You're reading an old version of this documentation. For up-to-date information, please have a look at v0.12.
Models: Voigt profiles
Classes used:
Models:
Plotting:
The Voigt profile (after Woldemar Voigt) is a probability distribution given by a convolution of a Cauchy-Lorentz distribution (with half-width at half-maximum gamma) and a Gaussian distribution (with standard deviation sigma). It is often used for analyzing spectroscopic data.
In spectroscopy, a Voigt profile results from the convolution of two broadening mechanisms: life-time broadening (Lorentzian part) and inhomogeneous broadening (Gaussian part).
Recipe
aspecd.model.Voigtian. As the Voigt profile is a convolution of a Gaussian and Lorentzian line, setting the contribution of either component to zero should result in pure Lorentzian or Gaussian lines, respectively. This is demonstrated, and furthermore the variation of the parameters gamma and sigma for the line widths of the Lorentzian and Gaussian component, respectively. The latter reproduces the figure shown in the documentation of the underlying function scipy.special.voigt_profile(). 1format:
2 type: ASpecD recipe
3 version: '0.2'
4
5tasks:
6 - kind: model
7 type: Zeros
8 properties:
9 parameters:
10 shape: 1001
11 range: [-10, 10]
12 result: dummy
13
14 - kind: model
15 type: Voigtian
16 from_dataset: dummy
17 result: voigtian
18 comment: >
19 Create Voigt profile with default parameters
20
21 - kind: singleplot
22 type: SinglePlotter1D
23 properties:
24 properties:
25 axes:
26 ylim: [-0.01, 0.22]
27 ylabel: Null
28 parameters:
29 tight_layout: True
30 filename: model-voigt-profile.pdf
31 apply_to: voigtian
32 comment: >
33 Plot Voigt profile with default parameters
34
35 - kind: model
36 type: NormalisedGaussian
37 from_dataset: dummy
38 result: gaussian
39 comment: >
40 Create normalised Gaussian to compare with Voigt with gamma = 0
41
42 - kind: model
43 type: NormalisedLorentzian
44 from_dataset: dummy
45 result: lorentzian
46 comment: >
47 Create normalised Lorentzian to compare with Voigt with sigma = 0
48
49 - kind: model
50 type: Voigtian
51 from_dataset: dummy
52 properties:
53 parameters:
54 gamma: 0
55 result: voigtian_gamma_0
56 comment: >
57 Create Voigt profile with gamma = 0, i.e., purely Gaussian line shape
58
59 - kind: model
60 type: Voigtian
61 from_dataset: dummy
62 properties:
63 parameters:
64 sigma: 0
65 result: voigtian_sigma_0
66 comment: >
67 Create Voigt profile with sigma = 0, i.e., purely Lorentzian line shape
68
69 - kind: multiplot
70 type: MultiPlotter1D
71 properties:
72 properties:
73 axes:
74 ylim: [-0.01, 0.33]
75 ylabel: Null
76 drawings:
77 - label: Voigt
78 - label: Lorentz
79 parameters:
80 tight_layout: True
81 show_legend: True
82 filename: model-voigt-compare-lorentz.pdf
83 apply_to:
84 - voigtian_sigma_0
85 - lorentzian
86 comment: >
87 Compare Voigt profile with sigma = 0 to Lorentzian
88
89 - kind: multiplot
90 type: MultiPlotter1D
91 properties:
92 properties:
93 axes:
94 ylim: [-0.01, 0.41]
95 ylabel: Null
96 drawings:
97 - label: Voigt
98 - label: Gauss
99 parameters:
100 tight_layout: True
101 show_legend: True
102 filename: model-voigt-compare-gauss.pdf
103 apply_to:
104 - voigtian_gamma_0
105 - gaussian
106 comment: >
107 Compare Voigt profile with gamma = 0 to Gaussian
108
109 - kind: model
110 type: Voigtian
111 from_dataset: dummy
112 properties:
113 parameters:
114 sigma: 1.5
115 gamma: 0
116 result: voigtian_sigma_1_5_gamma_0
117 comment: >
118 Create Voigt profile with sigma = 1.5, gamma = 0
119
120 - kind: model
121 type: Voigtian
122 from_dataset: dummy
123 properties:
124 parameters:
125 sigma: 1.3
126 gamma: 0.5
127 result: voigtian_sigma_1_3_gamma_0_5
128 comment: >
129 Create Voigt profile with sigma = 1.3, gamma = 0.5
130
131 - kind: model
132 type: Voigtian
133 from_dataset: dummy
134 properties:
135 parameters:
136 sigma: 0
137 gamma: 1.8
138 result: voigtian_sigma_0_gamma_1.8
139 comment: >
140 Create Voigt profile with sigma = 0, gamma = 1.8
141
142 - kind: multiplot
143 type: MultiPlotter1D
144 properties:
145 properties:
146 axes:
147 ylim: [-0.01, 0.28]
148 ylabel: Null
149 drawings:
150 - label: $\sigma = 1.5, \gamma = 0.0$
151 - label: $\sigma = 1.3, \gamma = 0.5$
152 - label: $\sigma = 0.0, \gamma = 1.8$
153 - label: $\sigma = 1.0, \gamma = 1.0$
154 parameters:
155 tight_layout: True
156 show_legend: True
157 filename: model-voigt-variations.pdf
158 apply_to:
159 - voigtian_sigma_1_5_gamma_0
160 - voigtian_sigma_1_3_gamma_0_5
161 - voigtian_sigma_0_gamma_1.8
162 - voigtian
163 comment: >
164 Compare Voigt profiles as shown in scipy.special.voigt_profile example
Results
Examples for the figures created in the recipe are given below. While in the recipe, the output format has been set to PDF, for rendering them here they have been converted to PNG.
Note
The command line magic used to convert the PDF images to PNG images was:
for k in model-voigt*pdf; do echo ${k%.*}; convert -density 180 $k ${k%.*}.png; done
A Voigt profile with standard parameters, i.e. gamma = 1 and sigma = 1, results in a line shape with additive line widths of Lorentzian and Gaussian contributions. Hence, the line is clearly wider than the individual components, as shown below.
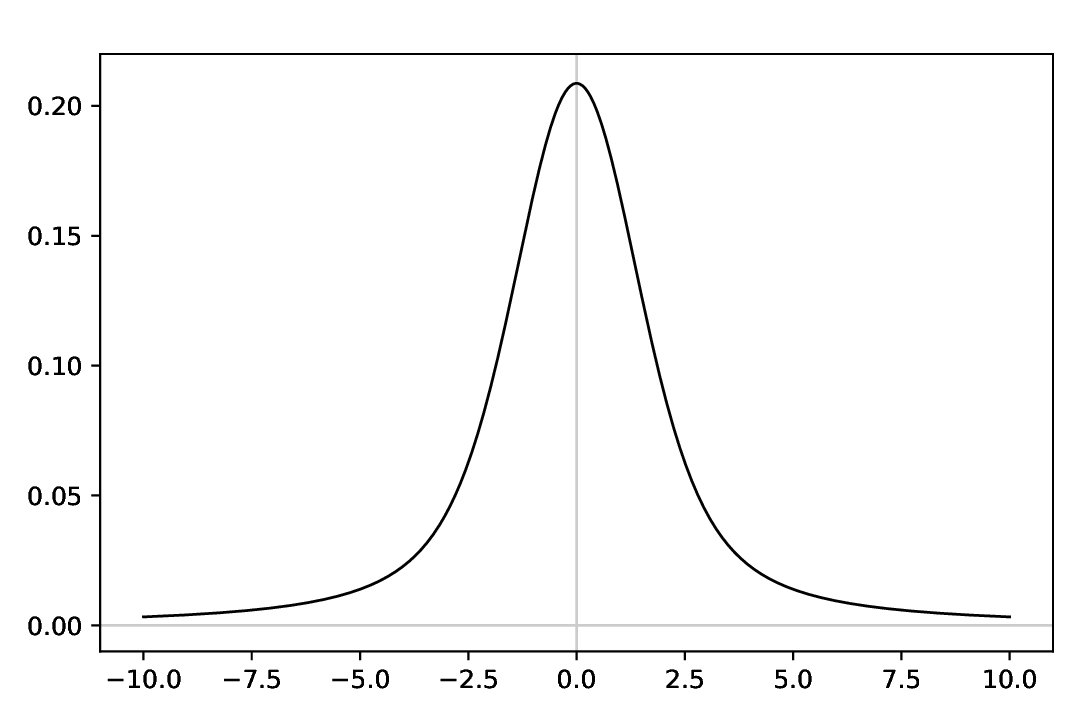
Fig. 5 Voigt profile with standard parameters, i.e. gamma = 1 and sigma = 1.
As a Voigt profile is a convolution of Lorentzian and Gaussian contributions, setting the line width of either contribution to zero should result in a pure line shape, either Lorentzian or Gaussian. This is demonstrated below for both cases.
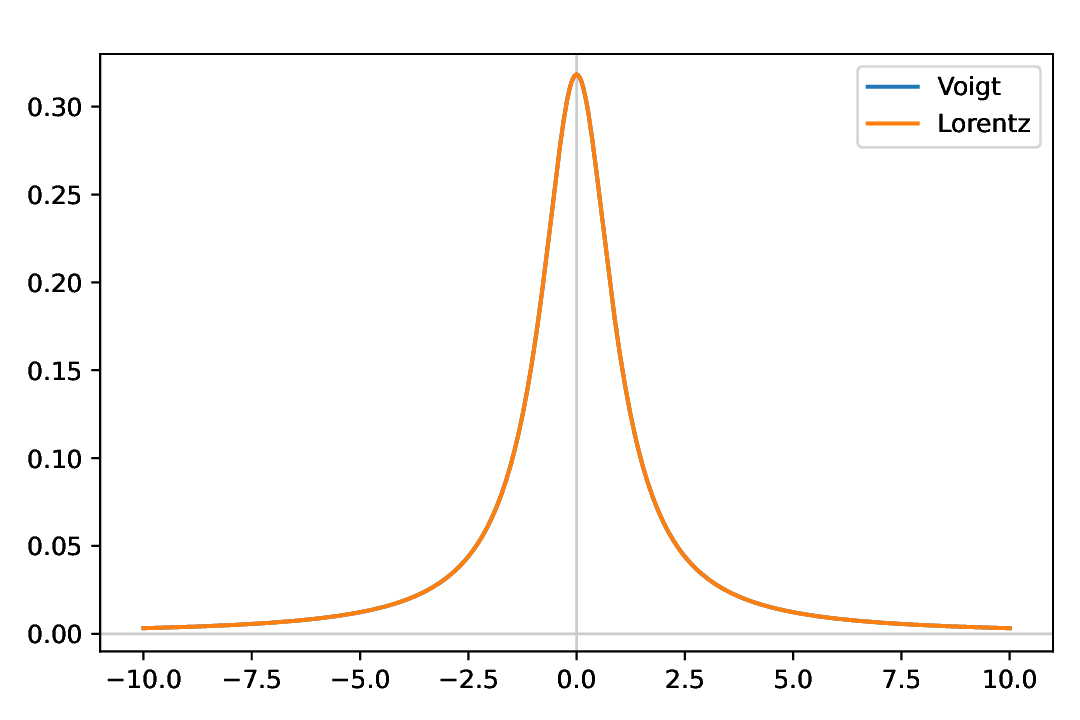
Fig. 6 Comparing a Voigt profile with purely Lorentzian contributions, i.e. gamma = 1 and sigma = 0, to a (normalised) Lorentzian. The lines completely overlap, as expected.
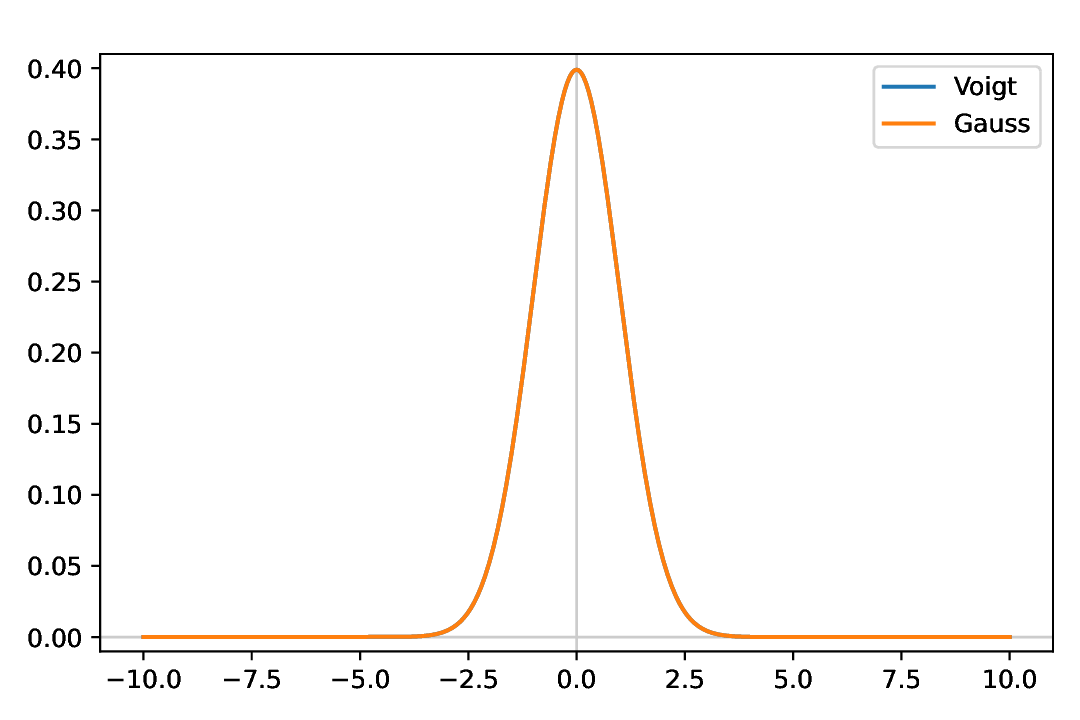
Fig. 7 Comparing a Voigt profile with purely Gaussian contributions, i.e. gamma = 0 and sigma = 1, to a (normalised) Gaussian. The lines completely overlap, as expected.
Last but not least, a figure from the documentation of the scipy.special.voigt_profile() used to compute the Voigt profile is recreated and shown below. For didactic purposes, the line widths of the Lorentzian (gamma) and Gaussian (sigma) components are varied.
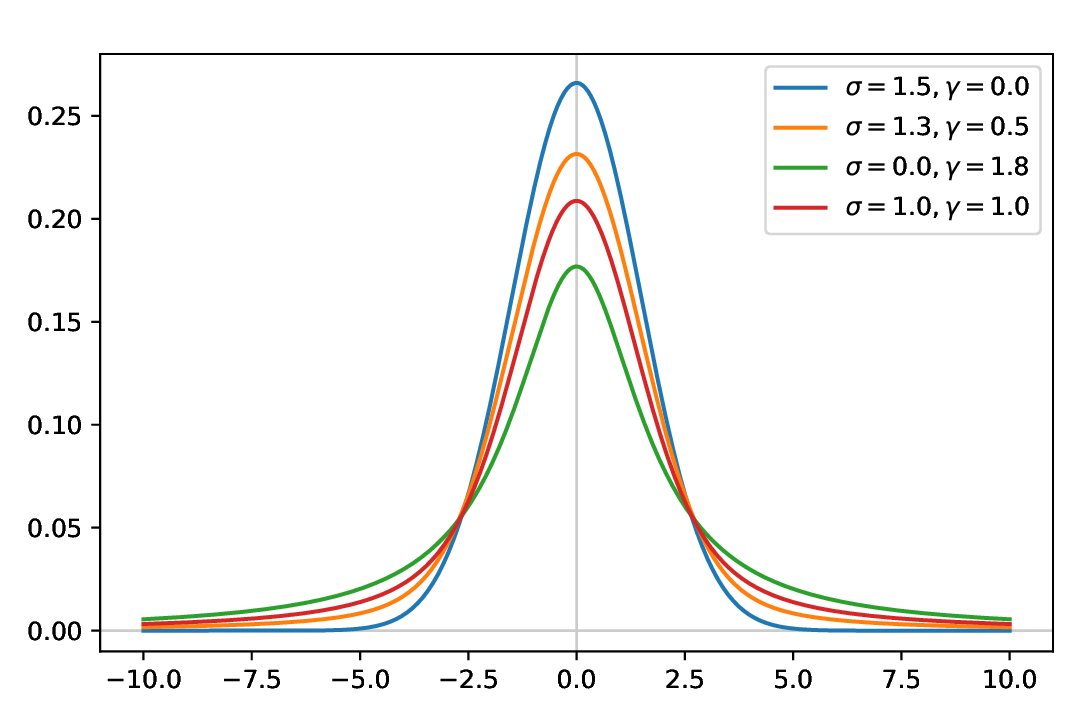
Fig. 8 Voigt profile with varying parameters for the Lorentzian (gamma) and Gaussian (sigma) contributions.
Comments
The recipe shown here does not import any data, hence does not have the usual top-level block
datasets, but directly starts with thetasksblock.To remove the y label, set it to
Nullin the recipe, the YAML analogon toNonein Python.