You're reading the documentation for a development version. For the latest released version, please have a look at v0.12.
Plotting: Composite plotter with shared axes
Classes used:
Models:
Plotting:
Composite plotter can be used to compare larger sets of data, and sometimes you want to share x or y axes or even both. Furthermore, you may want to share x axes column-wise and y axes row-wise. All this is possible, as shown below in a rather lengthly recipe. Just use the part you are interested in for your own purposes.
Recipe
Shown below is the entire recipe. As this is quite lengthly, separate parts will be detailed below in the “Results” section.
  1format:
  2  type: ASpecD recipe
  3  version: '0.3'
  4
  5settings:
  6  autosave_plots: False
  7
  8tasks:
  9  - kind: model
 10    type: Zeros
 11    properties:
 12      parameters:
 13        shape: 1001
 14        range: [-10, 10]
 15    result: dummy-1
 16
 17  - kind: model
 18    type: Zeros
 19    properties:
 20      parameters:
 21        shape: 1001
 22        range: [-8, 8]
 23    result: dummy-2
 24
 25  - kind: model
 26    type: NormalisedGaussian
 27    from_dataset: dummy-1
 28    result: gaussian-1
 29    comment: >
 30      Create normalised Gaussian profile with default parameters
 31
 32  - kind: model
 33    type: NormalisedGaussian
 34    from_dataset: dummy-1
 35    properties:
 36      parameters:
 37        width: 1.5
 38    result: gaussian-2
 39    comment: >
 40      Create normalised Gaussian profile with width=1.5
 41
 42  - kind: model
 43    type: NormalisedGaussian
 44    from_dataset: dummy-2
 45    properties:
 46      parameters:
 47        width: 2.0
 48    result: gaussian-3
 49    comment: >
 50      Create normalised Gaussian profile with width=2.0
 51
 52  - kind: model
 53    type: NormalisedGaussian
 54    from_dataset: dummy-2
 55    properties:
 56      parameters:
 57        width: 0.5
 58    result: gaussian-4
 59    comment: >
 60      Create normalised Gaussian profile with width=0.5
 61
 62  - kind: singleplot
 63    type: SinglePlotter1D
 64    properties:
 65      properties:
 66        axes:
 67          xlabel: "$position$ / a.u."
 68      parameters:
 69        tight_layout: True
 70    apply_to:
 71      - gaussian-1
 72      - gaussian-2
 73      - gaussian-3
 74      - gaussian-4
 75    result:
 76      - plot-1
 77      - plot-2
 78      - plot-3
 79      - plot-4
 80    comment: >
 81      Plotters used in CompositePlotter below
 82
 83  - kind: compositeplot
 84    type: CompositePlotter
 85    properties:
 86      properties:
 87        grid_spec:
 88          wspace: 0
 89      parameters:
 90        tight_layout: True
 91      plotter:
 92        - plot-1
 93        - plot-2
 94        - plot-3
 95        - plot-4
 96      grid_dimensions: [2, 2]
 97      subplot_locations:
 98        - [0, 0, 1, 1]
 99        - [0, 1, 1, 1]
100        - [1, 0, 1, 1]
101        - [1, 1, 1, 1]
102      filename: plotting-compositeplotter-share-y-axes.pdf
103      sharey: True
104      comment: >
105        Composite plotter with shared y axes
106
107  - kind: compositeplot
108    type: CompositePlotter
109    properties:
110      properties:
111        grid_spec:
112          wspace: 0
113      parameters:
114        tight_layout: True
115      plotter:
116        - plot-2
117        - plot-1
118        - plot-4
119        - plot-3
120      grid_dimensions: [2, 2]
121      subplot_locations:
122        - [0, 1, 1, 1]
123        - [0, 0, 1, 1]
124        - [1, 1, 1, 1]
125        - [1, 0, 1, 1]
126      filename: plotting-compositeplotter-share-y-axes-wo-inner-ticks.pdf
127      sharey: True
128      comment: >
129        Composite plotter with shared y axes and no inner ticks
130
131  - kind: compositeplot
132    type: CompositePlotter
133    properties:
134      properties:
135        grid_spec:
136          hspace: 0
137      parameters:
138        tight_layout: True
139      plotter:
140        - plot-1
141        - plot-2
142        - plot-3
143        - plot-4
144      grid_dimensions: [2, 2]
145      subplot_locations:
146        - [0, 0, 1, 1]
147        - [0, 1, 1, 1]
148        - [1, 0, 1, 1]
149        - [1, 1, 1, 1]
150      filename: plotting-compositeplotter-share-x-axes.pdf
151      sharex: True
152      comment: >
153        Composite plotter with shared x axes
154
155  - kind: compositeplot
156    type: CompositePlotter
157    properties:
158      properties:
159        grid_spec:
160          hspace: 0
161      parameters:
162        tight_layout: True
163      plotter:
164        - plot-1
165        - plot-3
166        - plot-2
167        - plot-4
168      grid_dimensions: [2, 2]
169      subplot_locations:
170        - [0, 0, 1, 1]
171        - [0, 1, 1, 1]
172        - [1, 0, 1, 1]
173        - [1, 1, 1, 1]
174      filename: plotting-compositeplotter-share-x-axes-column-wise.pdf
175      sharex: column-wise
176      comment: >
177        Composite plotter with column-wise shared x axes
178
179  - kind: compositeplot
180    type: CompositePlotter
181    properties:
182      properties:
183        grid_spec:
184          wspace: 0
185      parameters:
186        tight_layout: True
187      plotter:
188        - plot-1
189        - plot-3
190        - plot-2
191        - plot-4
192      grid_dimensions: [2, 2]
193      subplot_locations:
194        - [0, 0, 1, 1]
195        - [0, 1, 1, 1]
196        - [1, 0, 1, 1]
197        - [1, 1, 1, 1]
198      filename: plotting-compositeplotter-share-y-axes-row-wise.pdf
199      sharey: row-wise
200      comment: >
201        Composite plotter with row-wise shared y axes
202
203  - kind: compositeplot
204    type: CompositePlotter
205    properties:
206      properties:
207        grid_spec:
208          wspace: 0
209          hspace: 0
210        axes:
211          ylim: [-0.05, 0.85]
212      parameters:
213        tight_layout: True
214      plotter:
215        - plot-1
216        - plot-2
217        - plot-3
218        - plot-4
219      grid_dimensions: [2, 2]
220      subplot_locations:
221        - [0, 0, 1, 1]
222        - [0, 1, 1, 1]
223        - [1, 0, 1, 1]
224        - [1, 1, 1, 1]
225      filename: plotting-compositeplotter-share-x-y-axes.pdf
226      sharex: True
227      sharey: True
228      comment: >
229        Composite plotter with shared x and y axes
Results
Examples for the figures created in the recipe are given below. While in the recipe, the output format has been set to PDF, for rendering them here they have been converted to PNG.
Note
The command line magic used to convert the PDF images to PNG images was:
for k in plotting-compositeplotter-share*pdf; do echo ${k%.*}; convert -density 180 $k ${k%.*}.png; done
As this is a rather lengthy recipe demonstrating many different scenarios, the individual cases are shown separately, each with the corresponding section of the recipe.
All y axes shared
As a first example, all y axes are shared. With no further adjusting of the y axes, this may lead to unwanted effects, as shown in the corresponding figure. Furthermore, the y ticks of the right subplots are shown, due to the sequence of subplots from left to right. The right panels are plotted after the left ones, and hence their y ticks not hidden below the left panels. For shared x axes and plotting from top to bottom, all x ticks except of the lowest are usually hidden when the spacing between the subplots is set to zero.
 83  - kind: compositeplot
 84    type: CompositePlotter
 85    properties:
 86      properties:
 87        grid_spec:
 88          wspace: 0
 89      parameters:
 90        tight_layout: True
 91      plotter:
 92        - plot-1
 93        - plot-2
 94        - plot-3
 95        - plot-4
 96      grid_dimensions: [2, 2]
 97      subplot_locations:
 98        - [0, 0, 1, 1]
 99        - [0, 1, 1, 1]
100        - [1, 0, 1, 1]
101        - [1, 1, 1, 1]
102      filename: plotting-compositeplotter-share-y-axes.pdf
103      sharey: True
104      comment: >
105        Composite plotter with shared y axes
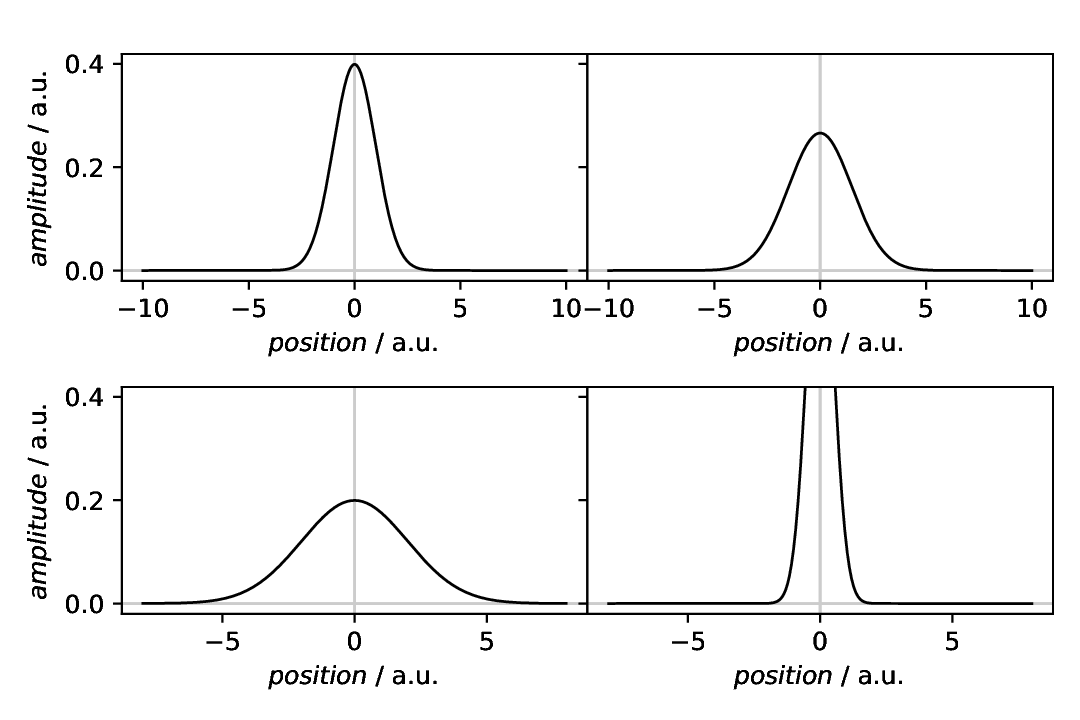
Fig. 9 Composite plotter with all y axes shared. Note that you can give both, True and all as options for the sharey key. Furthermore, the limits of the first defined axes (in our case top-left) are used for all other axes. Hence the vertically cut display in the bottom-right panel.
All y axes shared, no inner ticks
As mentioned above, with a typical plot sequence from left to right and no horizontal spacing between the panels, the ticks of the right panels are shown. To have these ticks hidden below the left panels, define the subplot locations differently, starting with the right column. Note, however, that this way another axes takes precedence as reference for the shared axes.
107  - kind: compositeplot
108    type: CompositePlotter
109    properties:
110      properties:
111        grid_spec:
112          wspace: 0
113      parameters:
114        tight_layout: True
115      plotter:
116        - plot-2
117        - plot-1
118        - plot-4
119        - plot-3
120      grid_dimensions: [2, 2]
121      subplot_locations:
122        - [0, 1, 1, 1]
123        - [0, 0, 1, 1]
124        - [1, 1, 1, 1]
125        - [1, 0, 1, 1]
126      filename: plotting-compositeplotter-share-y-axes-wo-inner-ticks.pdf
127      sharey: True
128      comment: >
129        Composite plotter with shared y axes and no inner ticks
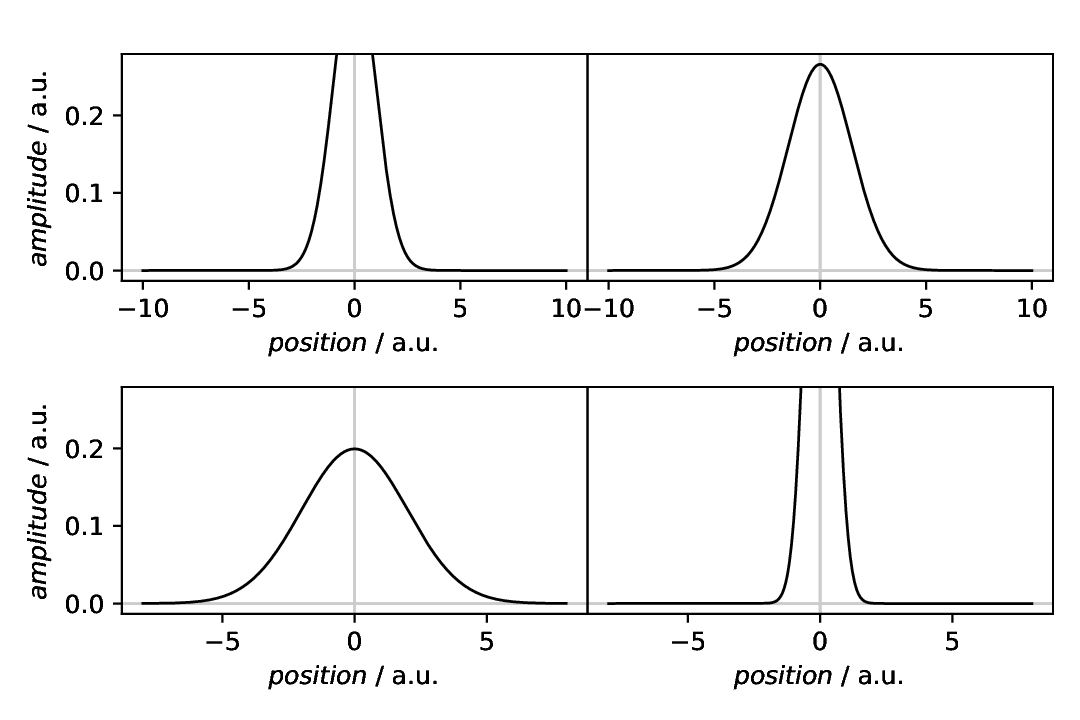
Fig. 10 Composite plotter with all y axes shared and no inner ticks. The limits of the first defined axes are used for all other axes – and in this case, it is the top-right subplot. Hence the vertically cut display in the top-left and bottom-right panels.
All x axes shared
Analogously to sharing y axes, you can share all x axes. Typically, you want to set the vertical distance to zero, hence the height of the figure reserved for spacing between panels: hspace.
131  - kind: compositeplot
132    type: CompositePlotter
133    properties:
134      properties:
135        grid_spec:
136          hspace: 0
137      parameters:
138        tight_layout: True
139      plotter:
140        - plot-1
141        - plot-2
142        - plot-3
143        - plot-4
144      grid_dimensions: [2, 2]
145      subplot_locations:
146        - [0, 0, 1, 1]
147        - [0, 1, 1, 1]
148        - [1, 0, 1, 1]
149        - [1, 1, 1, 1]
150      filename: plotting-compositeplotter-share-x-axes.pdf
151      sharex: True
152      comment: >
153        Composite plotter with shared x axes
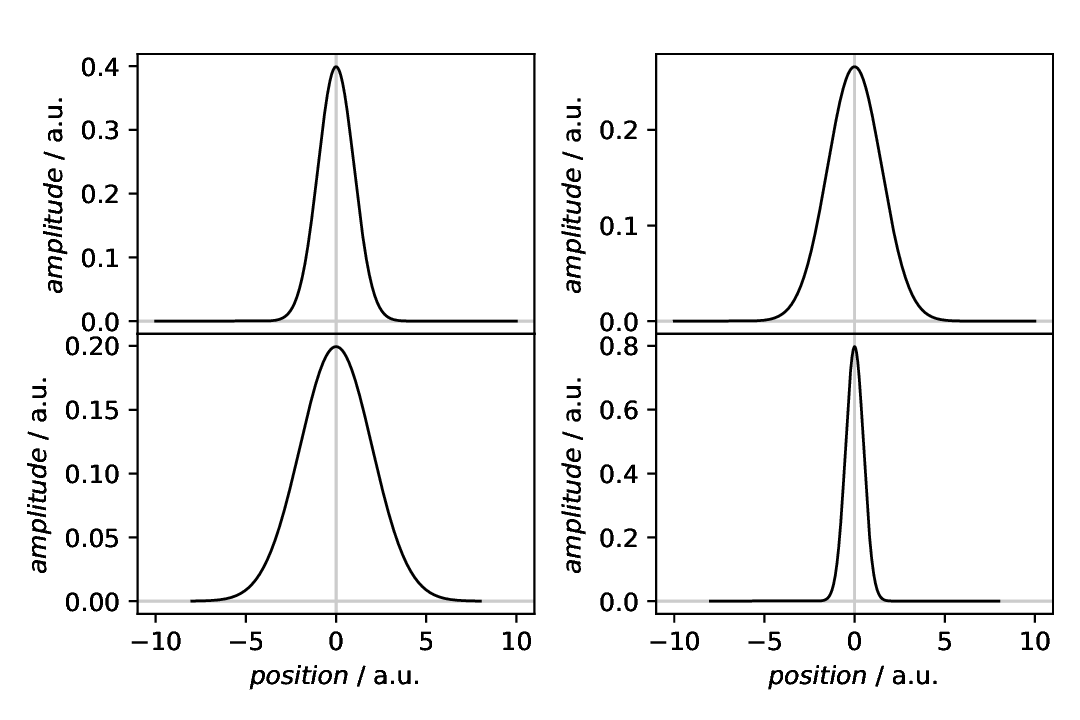
Fig. 11 Composite plotter with all x axes shared. The limits of the first defined axes are used for all other axes. In this case, no cutting of any axis takes place, as the first axis has the widest x limits.
Column-wise shared x axes
Depending on the use-case, you may want to share x axes not for all panels of a figure in a composite plot, but only column-wise. This can be done by setting the sharex key to one of ["col", "columns", "column-wise"].
155  - kind: compositeplot
156    type: CompositePlotter
157    properties:
158      properties:
159        grid_spec:
160          hspace: 0
161      parameters:
162        tight_layout: True
163      plotter:
164        - plot-1
165        - plot-3
166        - plot-2
167        - plot-4
168      grid_dimensions: [2, 2]
169      subplot_locations:
170        - [0, 0, 1, 1]
171        - [0, 1, 1, 1]
172        - [1, 0, 1, 1]
173        - [1, 1, 1, 1]
174      filename: plotting-compositeplotter-share-x-axes-column-wise.pdf
175      sharex: column-wise
176      comment: >
177        Composite plotter with column-wise shared x axes
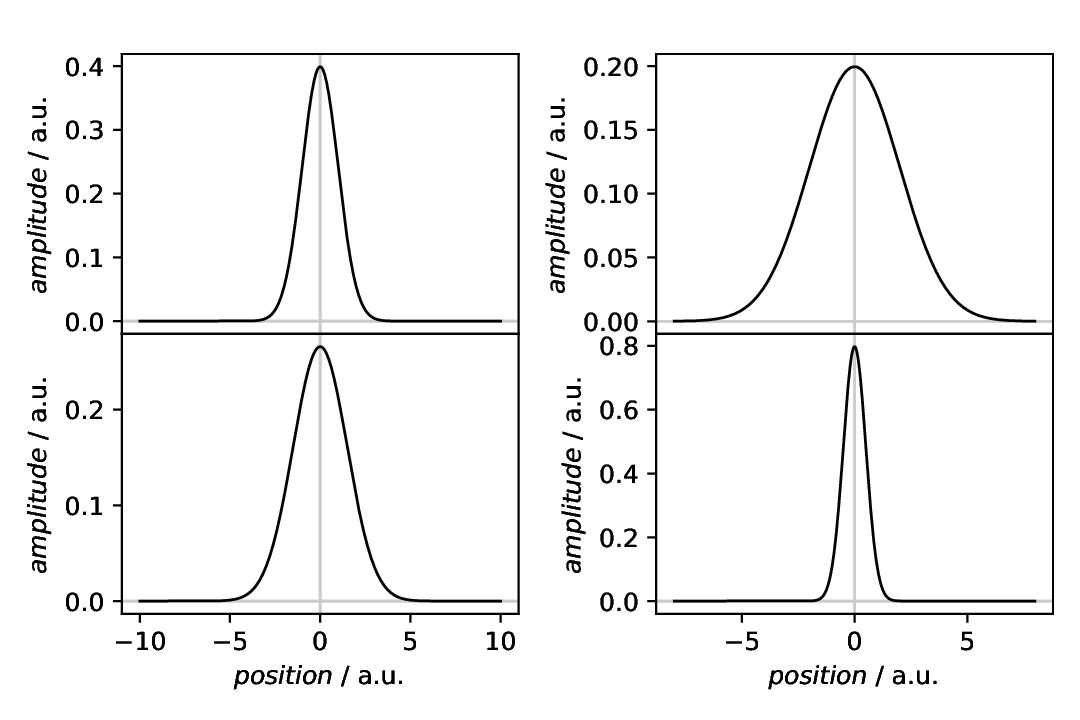
Fig. 12 Composite plotter with x axes shared column-wise. The limits of the first defined axes in each column are used for the other axes of the column. In this case, the plots have been rearranged such that the panels share the same x axis limits column-wise.
Row-wise shared y axes
Similarly to sharing x axes column-wise, you can share y axes row-wise instead of for all panels in a composite plot. This can be done by setting the sharey key to one of ["row", "rows", "row-wise"].
179  - kind: compositeplot
180    type: CompositePlotter
181    properties:
182      properties:
183        grid_spec:
184          wspace: 0
185      parameters:
186        tight_layout: True
187      plotter:
188        - plot-1
189        - plot-3
190        - plot-2
191        - plot-4
192      grid_dimensions: [2, 2]
193      subplot_locations:
194        - [0, 0, 1, 1]
195        - [0, 1, 1, 1]
196        - [1, 0, 1, 1]
197        - [1, 1, 1, 1]
198      filename: plotting-compositeplotter-share-y-axes-row-wise.pdf
199      sharey: row-wise
200      comment: >
201        Composite plotter with row-wise shared y axes
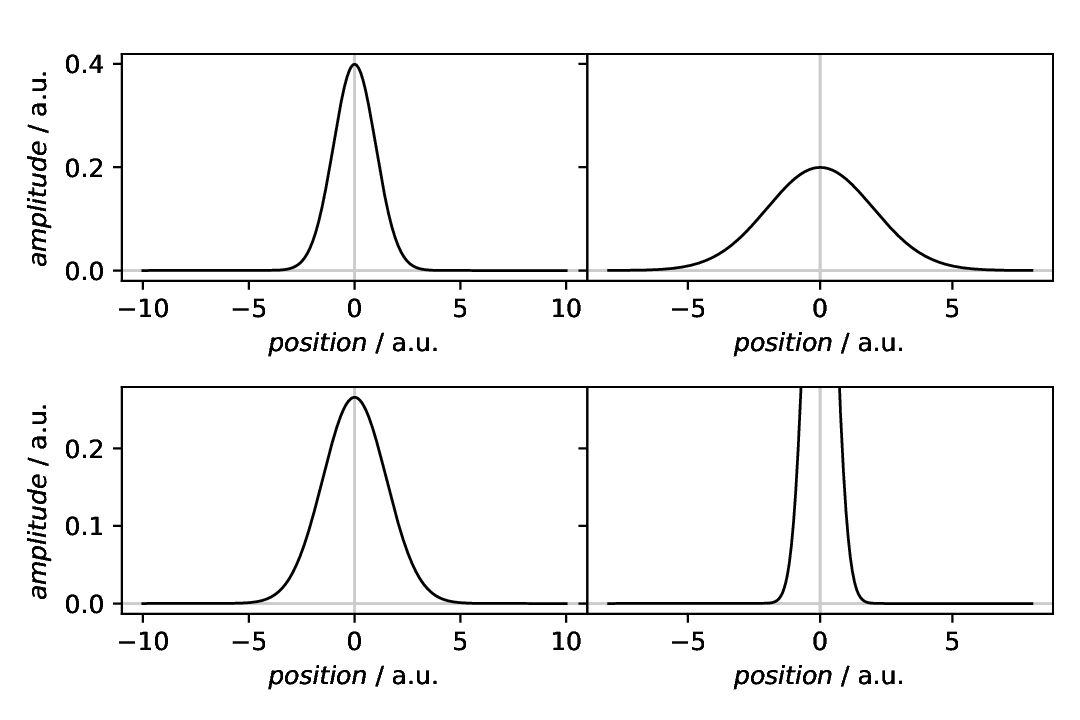
Fig. 13 Composite plotter with y axes shared row-wise. The limits of the first defined axes in each row are used for the other axes of the row. In this case, this leads to cutting of the line in the bottom-right panel.
Share x and y axes
Finally, an example for sharing both, x and y axes. In this case, you may want to set the spacing in both directions to zero. Furthermore, to not cut any line in this particular case, the ylim axes properties of the CompositePlotter are set, and these settings on this level always apply to all panels of the composite plot.
203  - kind: compositeplot
204    type: CompositePlotter
205    properties:
206      properties:
207        grid_spec:
208          wspace: 0
209          hspace: 0
210        axes:
211          ylim: [-0.05, 0.85]
212      parameters:
213        tight_layout: True
214      plotter:
215        - plot-1
216        - plot-2
217        - plot-3
218        - plot-4
219      grid_dimensions: [2, 2]
220      subplot_locations:
221        - [0, 0, 1, 1]
222        - [0, 1, 1, 1]
223        - [1, 0, 1, 1]
224        - [1, 1, 1, 1]
225      filename: plotting-compositeplotter-share-x-y-axes.pdf
226      sharex: True
227      sharey: True
228      comment: >
229        Composite plotter with shared x and y axes
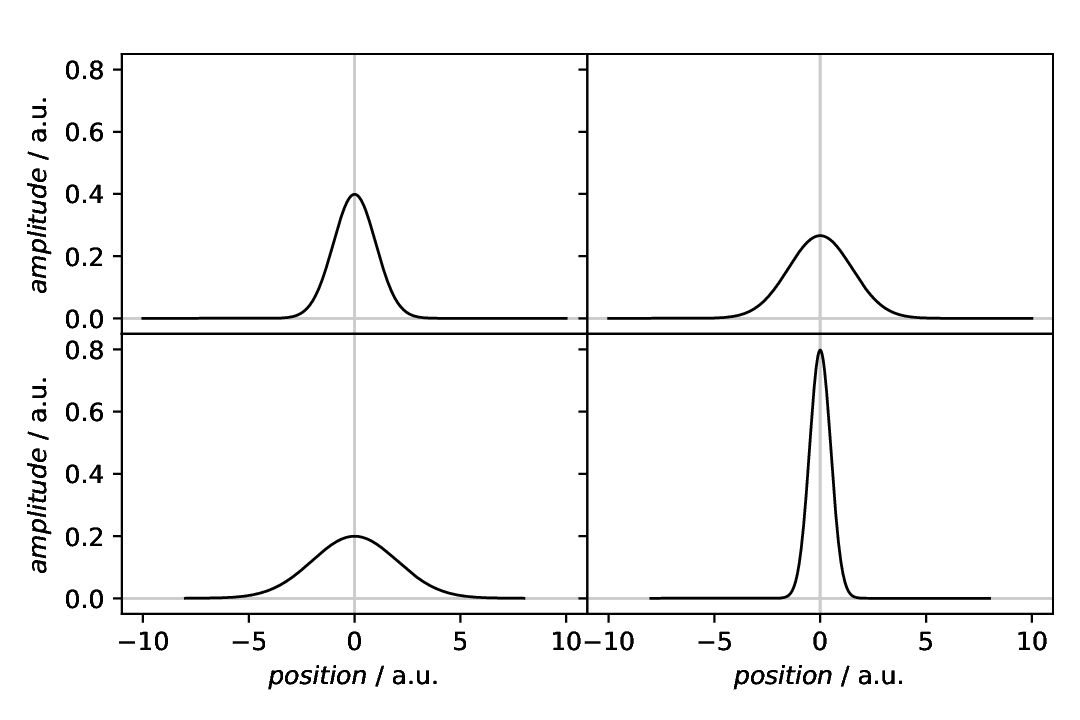
Fig. 14 Composite plotter with all x and y axes shared. The limits of the first defined axes are used for all the other axes. In this case, a global ylim has been set in the composite plotter to prevent cuttting of of any line.
Comments
As usual, a series of model datasets are created at the beginning, to have something to show. These are all normalised Gaussians with different line widths, resulting in different amplitudes.
For demonstration purposes, two different x ranges have been used for the Gaussians.
For simplicity, all datasets are plotted using the same plotter. Hence, to address the individual plotters in the
CompositePlotter, you need to provide labels using theresultkey.The sequence of defining subplot locations and plotter for the
CompositePlotterdoes matter, as the first defined axes (of a row/column) serves as reference for sharing axes with the other subplots.When sharing axes, only the outer labels are shown. For sharing x axes and plotting from top to bottom, this usually means that you do not see the x ticks for any but the lowest subplots. For sharing y axes and plotting left to right, as usual, you will see the y ticks of all axes, as they are not hidden by the other axes.
The space between the subplots can be set using the keys
wspaceandhspacefor the total amount of width or height for spacing between subplots. Set either to zero for axes directly next to each other.